Shuaijun Liu1, Qifu Wen2,3, Xingwei Chen1, Xinwen Hu4, Feiyang You1, Sijia Chen1, Ningxin Su1,*

1 The Hong Kong University of Science and Technology (Guangzhou)

2 Boston University   3 Shanghai Jiao Tong University   4 Tencent

* Corresponding author: Ningxin Su · ningxinsu@hkust-gz.edu.cn

Unified ocean-environment data, canonical multi-agent marine tasks, and cross-backend evaluation from scalable quantitative benchmarking to underwater scene deployment.

Abstract

Simulation is essential for marine robotics, yet existing platforms often trade off visual realism, experimental throughput, and ocean conditions derived from real data. We present OneOcean, a data-grounded simulation suite and benchmark that combines bathymetry, currents, and tides in a shared spatiotemporal dataset. Optional pollution fields support pollution-response evaluation. OneOcean defines ten tasks covering navigation, sensing, coordination, and pollution response, with teams of 2–10 vehicles. The simulator supports three to six Degrees of Freedom (DoF) and records standardized metrics and run configurations across tasks, difficulty tiers, and team sizes. Experiments across dataset variants and underwater scenes compare heuristic control, Behavior Cloning (BC), and Large Language Model (LLM)-assisted planning under ocean currents.
Overview

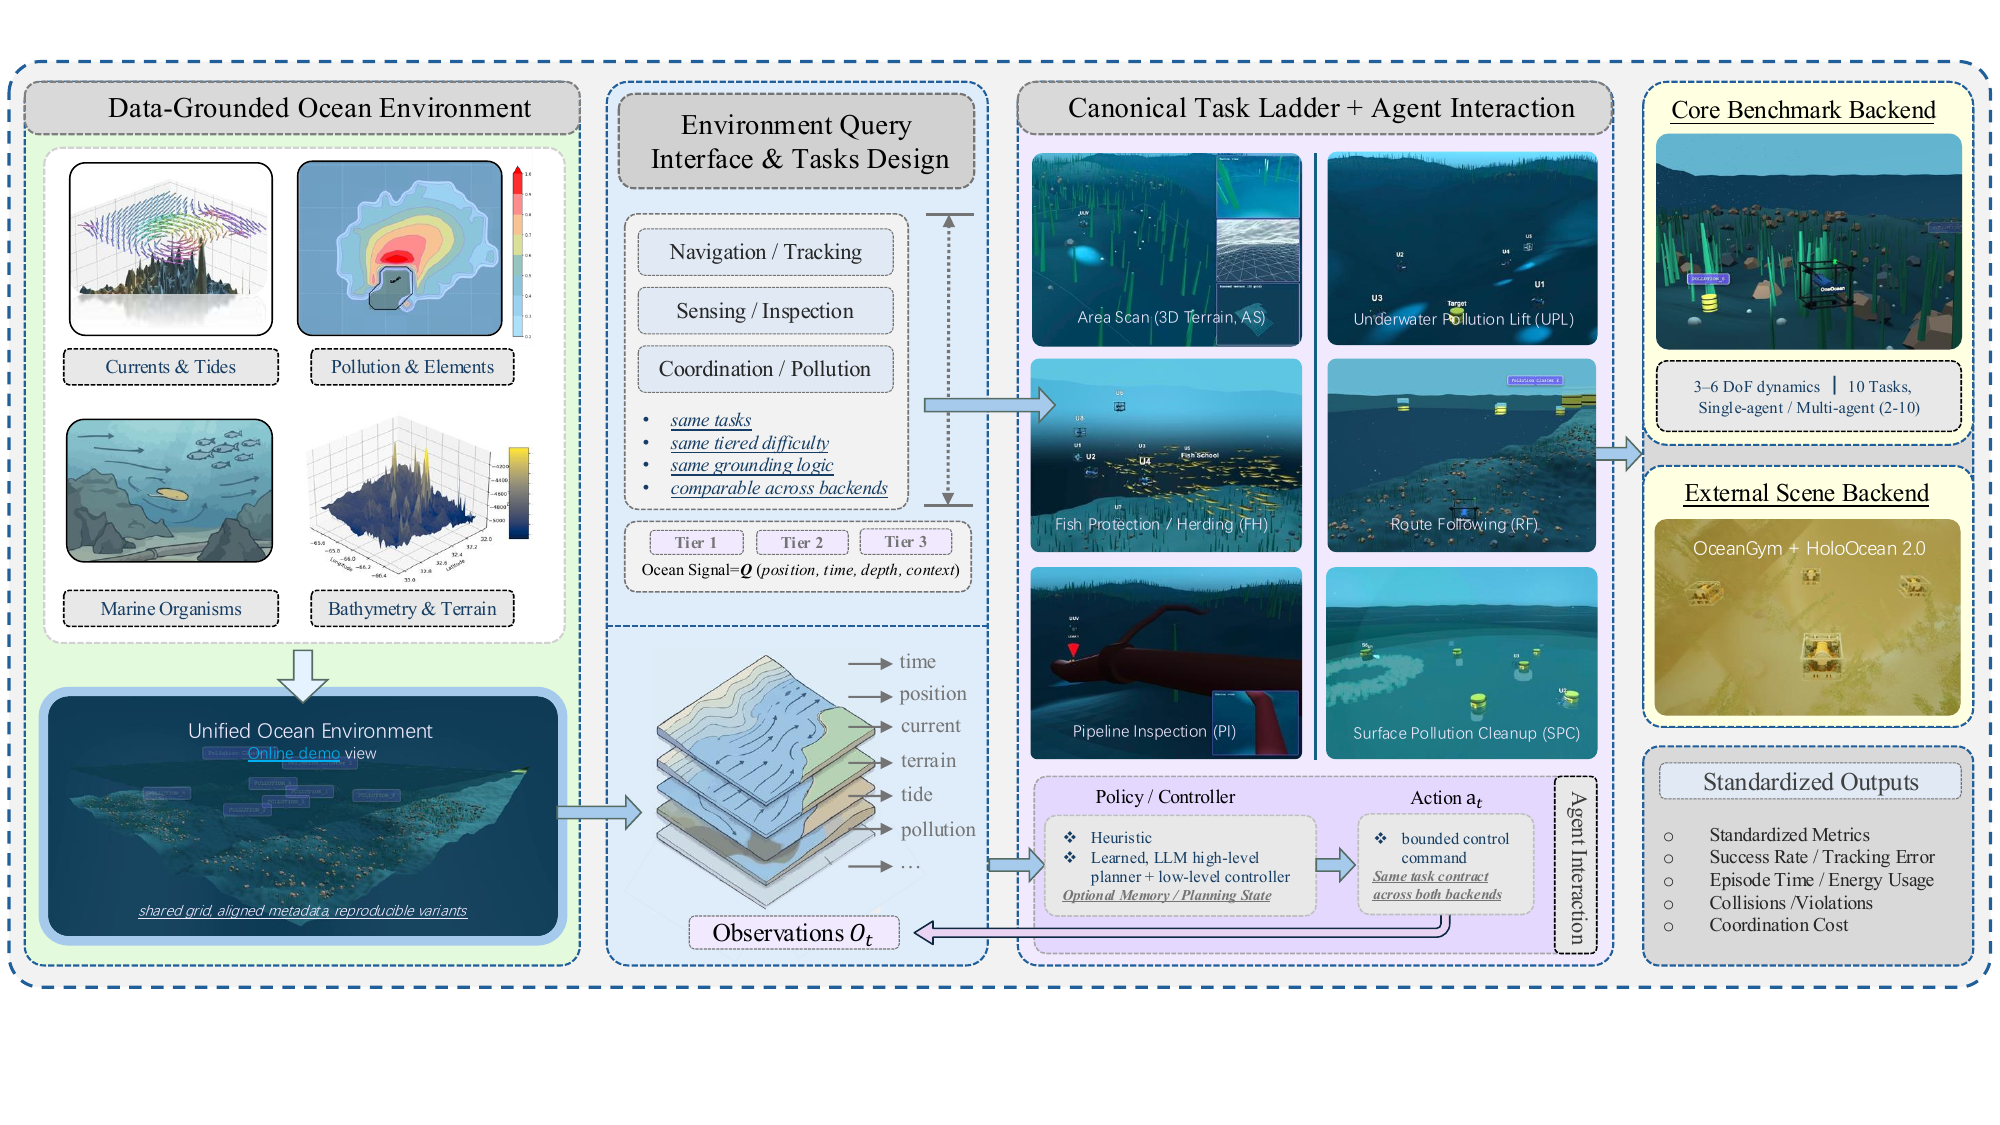
OneOcean overview

OneOcean overview.

A unified NetCDF environment dataset harmonizes GEBCO bathymetry, Copernicus / GOPAF currents, optional tide terms, and derived masks. This dataset supplies ocean conditions for the ten-task benchmark in both simulation backends.

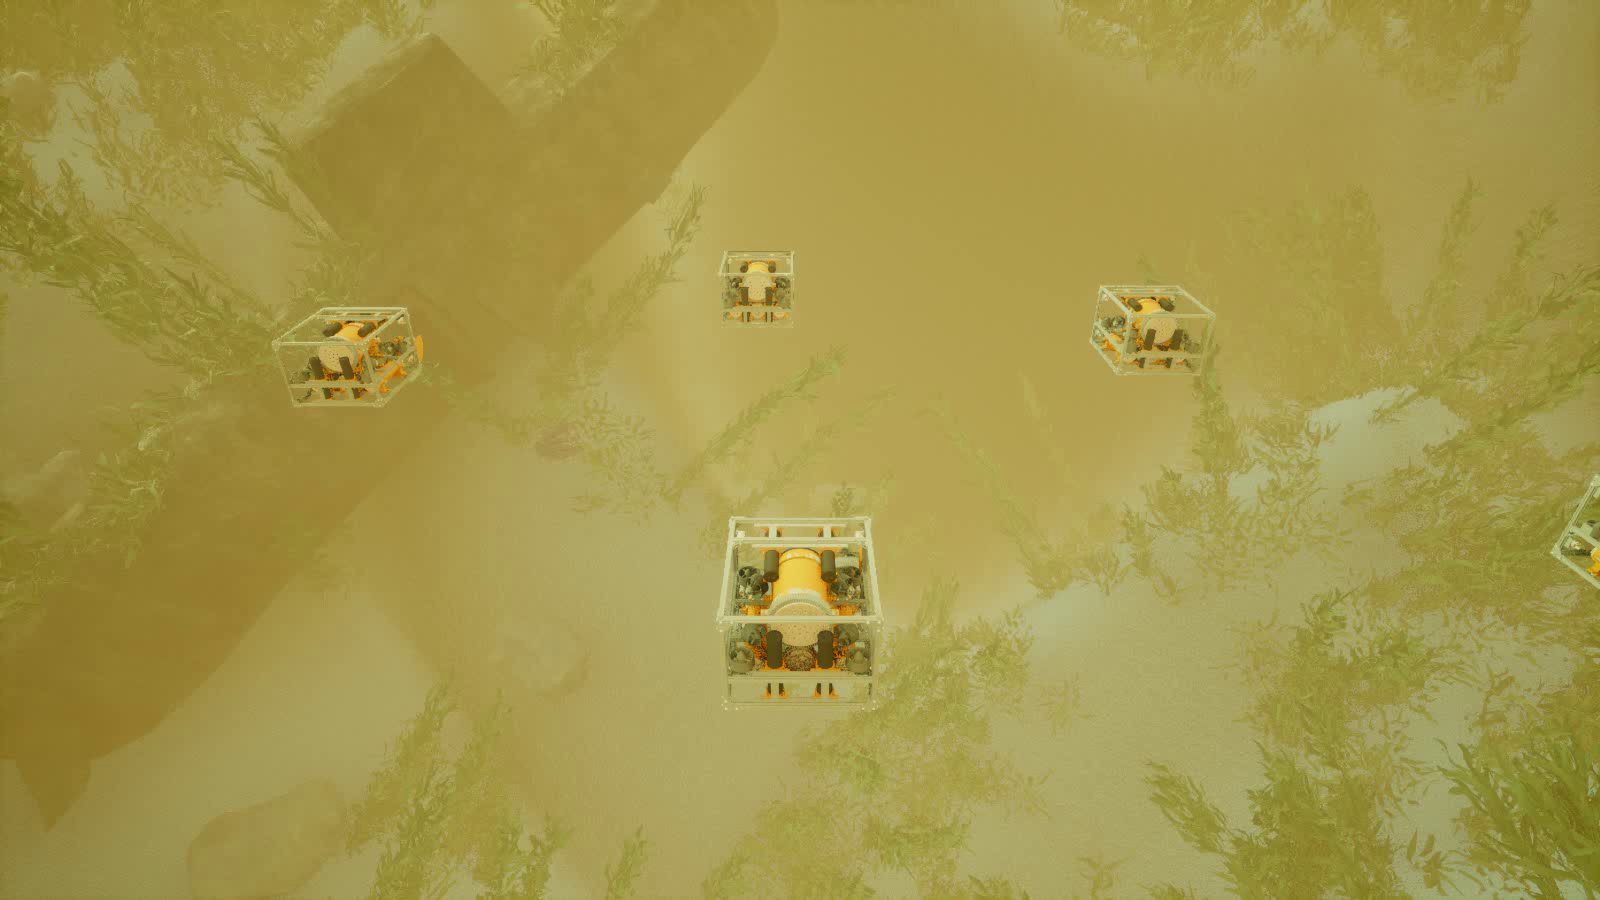
The core benchmark backend runs deterministic benchmark episodes at scale. The external underwater scene backend runs the same tasks in packaged underwater scenes using OneOcean currents.

Data. Ocean dataset with currents, bathymetry, masks, and source metadata.
Tasks. 10 tasks spanning navigation, sensing, coordination, and pollution response.
Evaluation. Shared metrics, three difficulty tiers, and support for 2-10 vehicles.

Method and Benchmark Design

OneOcean combines bathymetry and ocean currents in a shared dataset, exports currents to two simulation backends, and evaluates controllers on ten tasks with common metrics. The dataset can be regenerated for a chosen region, time window, and resolution.

Ocean Dataset

The data pipeline merges GEBCO bathymetry with Copernicus / GOPAF currents and optional tides into a combined NetCDF environment. Variant exports keep the schema fixed while changing coverage and resolution for tiny, scene, and public releases.

Two Backends

The core backend runs task and difficulty sweeps. The external backend runs tasks in packaged underwater scenes using exported OneOcean currents.

Evaluation Protocol

Tasks use three difficulty tiers and report success, efficiency, and task-specific progress. The simulator supports 3–6 DoF dynamics; the quantitative study uses the 6DoF setting. Run records include the configuration and dataset indices.

Task Families

Navigation and Tracking

Go-to-Goal under Currents (G2G), Station Keeping (SK), Route Following (RF), and Depth Profile Tracking (DPT) test disturbance rejection and sustained tracking under data grounded drift.

Sensing and Inspection

Area Scan (AS) and Pipeline Inspection (PI) stress coverage, event localization, and terrain-aware operation under the same grounded flow conditions.

Coordination and Pollution

Formation Transit (FT), Surface Pollution Cleanup (SPC), Underwater Pollution Lift (UPL), and Fish Protection / Herding (FH) emphasize team-size scaling, constraint satisfaction, localization, containment, and cleanup.

What the results show

The benchmark compares navigation, sensing, and coordination across task difficulties and simulation backends.

Heuristic denotes the deterministic task-specific baseline. Behavior Cloning (BC) is trained to imitate heuristic actions. LLM planners select source assignments or waypoints; all LLM runs use the same low-level controller and safety checks. Highlighted entries indicate the best value in each column.

Success across difficulty tiers

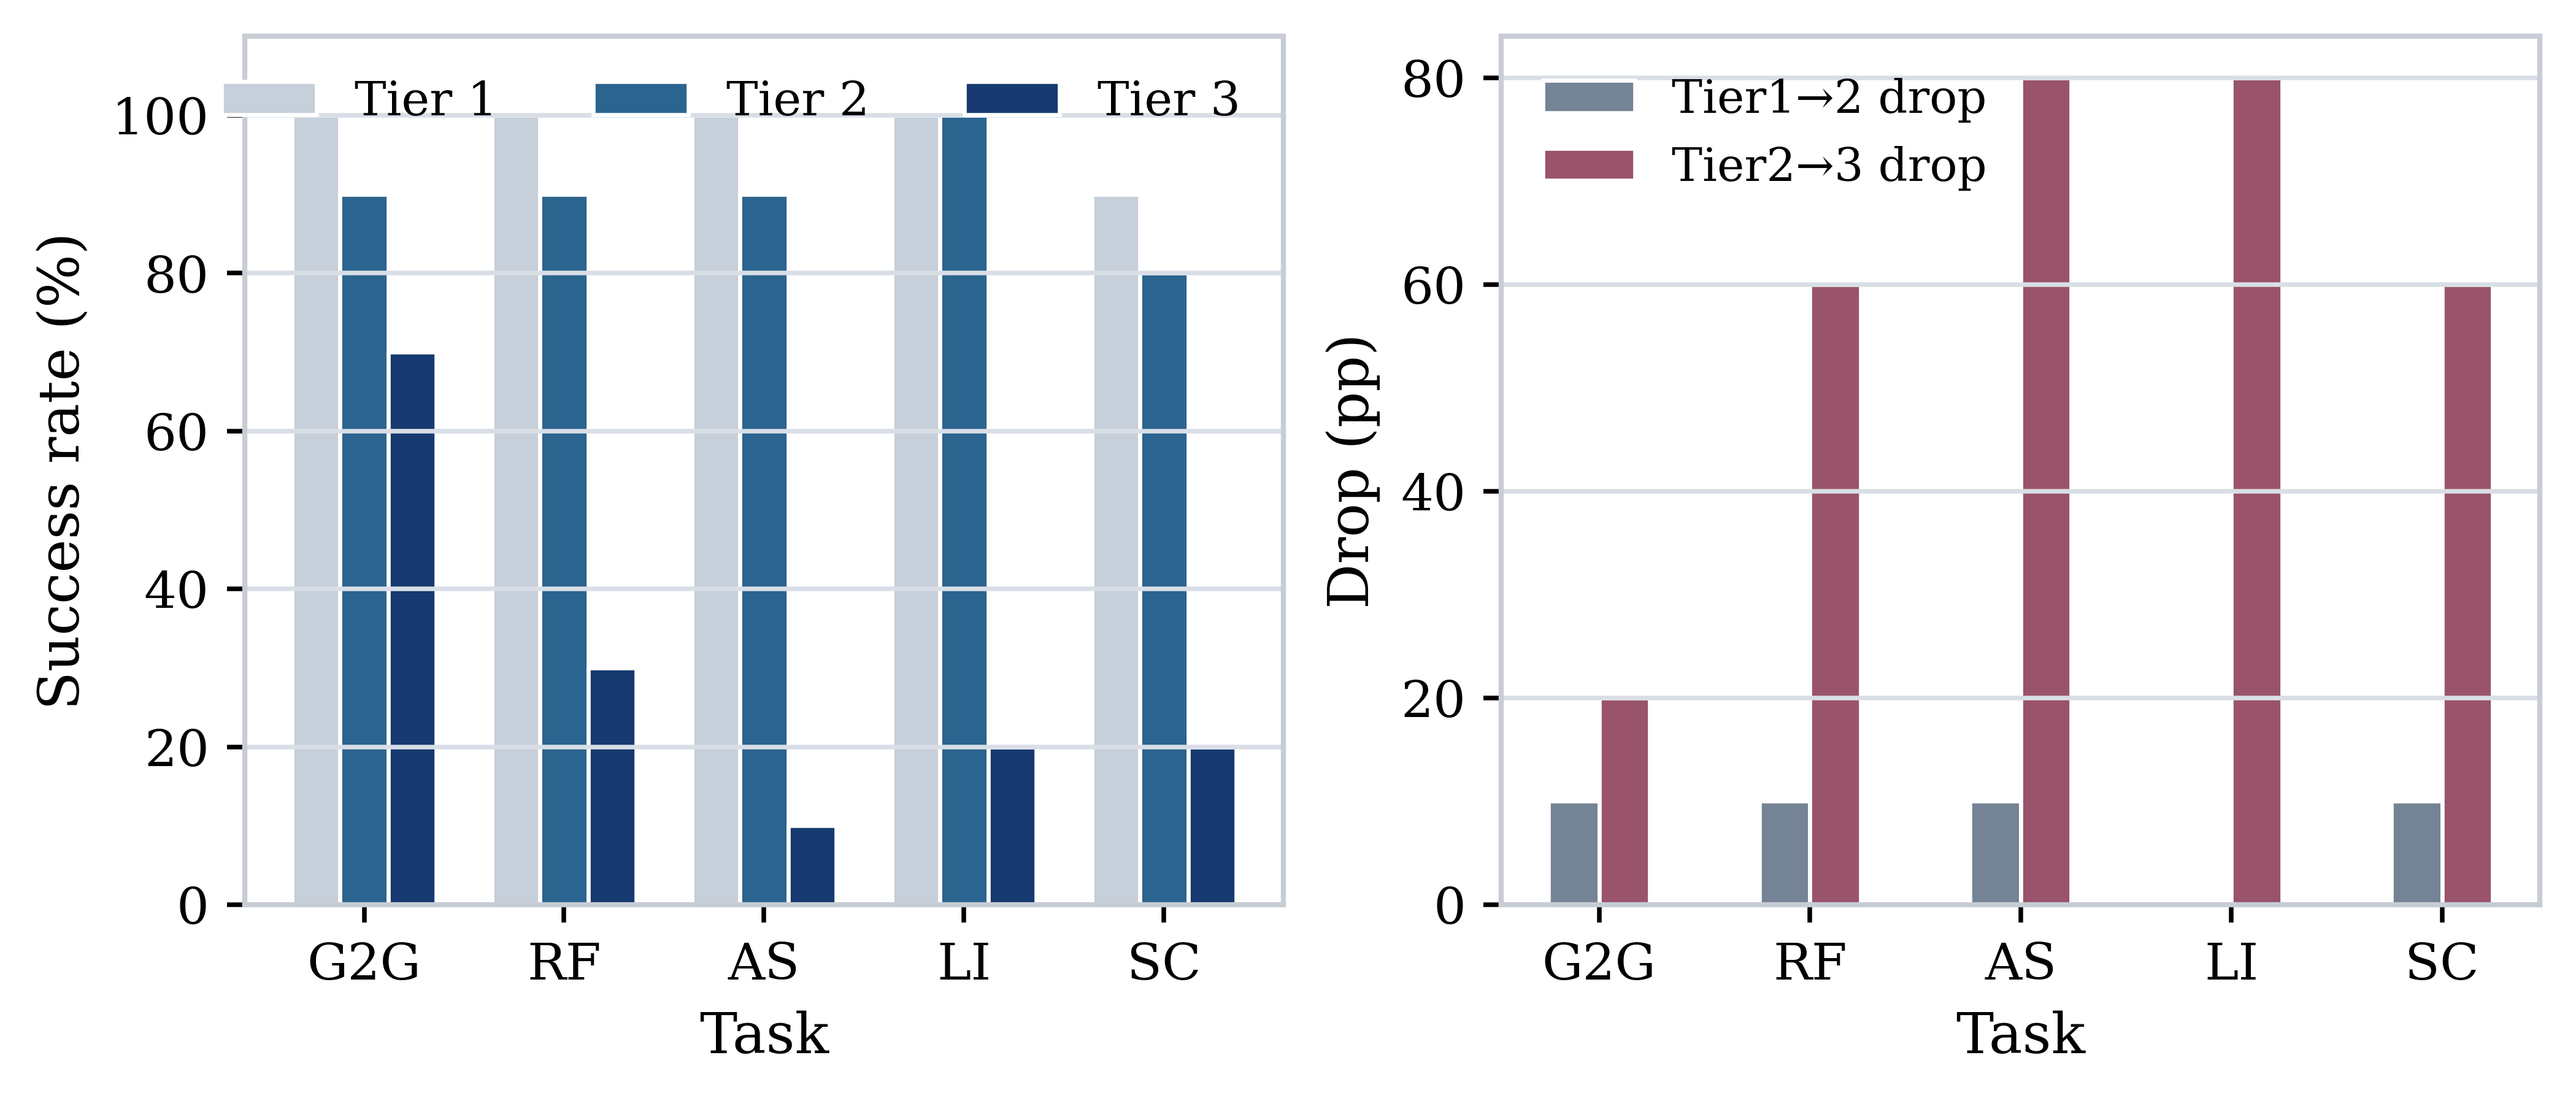
Across ten tasks, heuristic success decreases from 84.6% at Tier 2 to 29.0% at Tier 3; BC decreases from 58.6% to 6.0%.

Shared ocean data

Both backends use currents exported from the same ocean dataset and share task definitions.

Task-specific challenges

Navigation tests disturbance rejection, inspection tests coverage and detection, and pollution response tests assignment and coordination.

Core benchmark headline results

Macro results over the 10-task suite plus Tier 3 key-task metrics. Higher is better for success, coverage, inspection score, and cleanup rate; lower is better for the action-energy proxy E and collision ratio.

Method T2 Suite SR (%) T2 E T2 Coll (%) T3 Suite SR (%) T3 E T3 Coll (%) Go2Goal SR (%) Route SR (%) Station RMS Scan cov. Pipe score Cleanup rate
Heuristic 84.6 1842.3 5.68 29.0 3352.4 8.19 74.0 54.0 1.07 0.89 0.78 0.56
BC 58.6 1271.2 9.72 6.0 1635.1 6.41 34.0 0.0 26.52 0.89 0.67 0.06
Difficulty ladder summary

Success rates across difficulty tiers on representative tasks.

Cleanup scaling summary

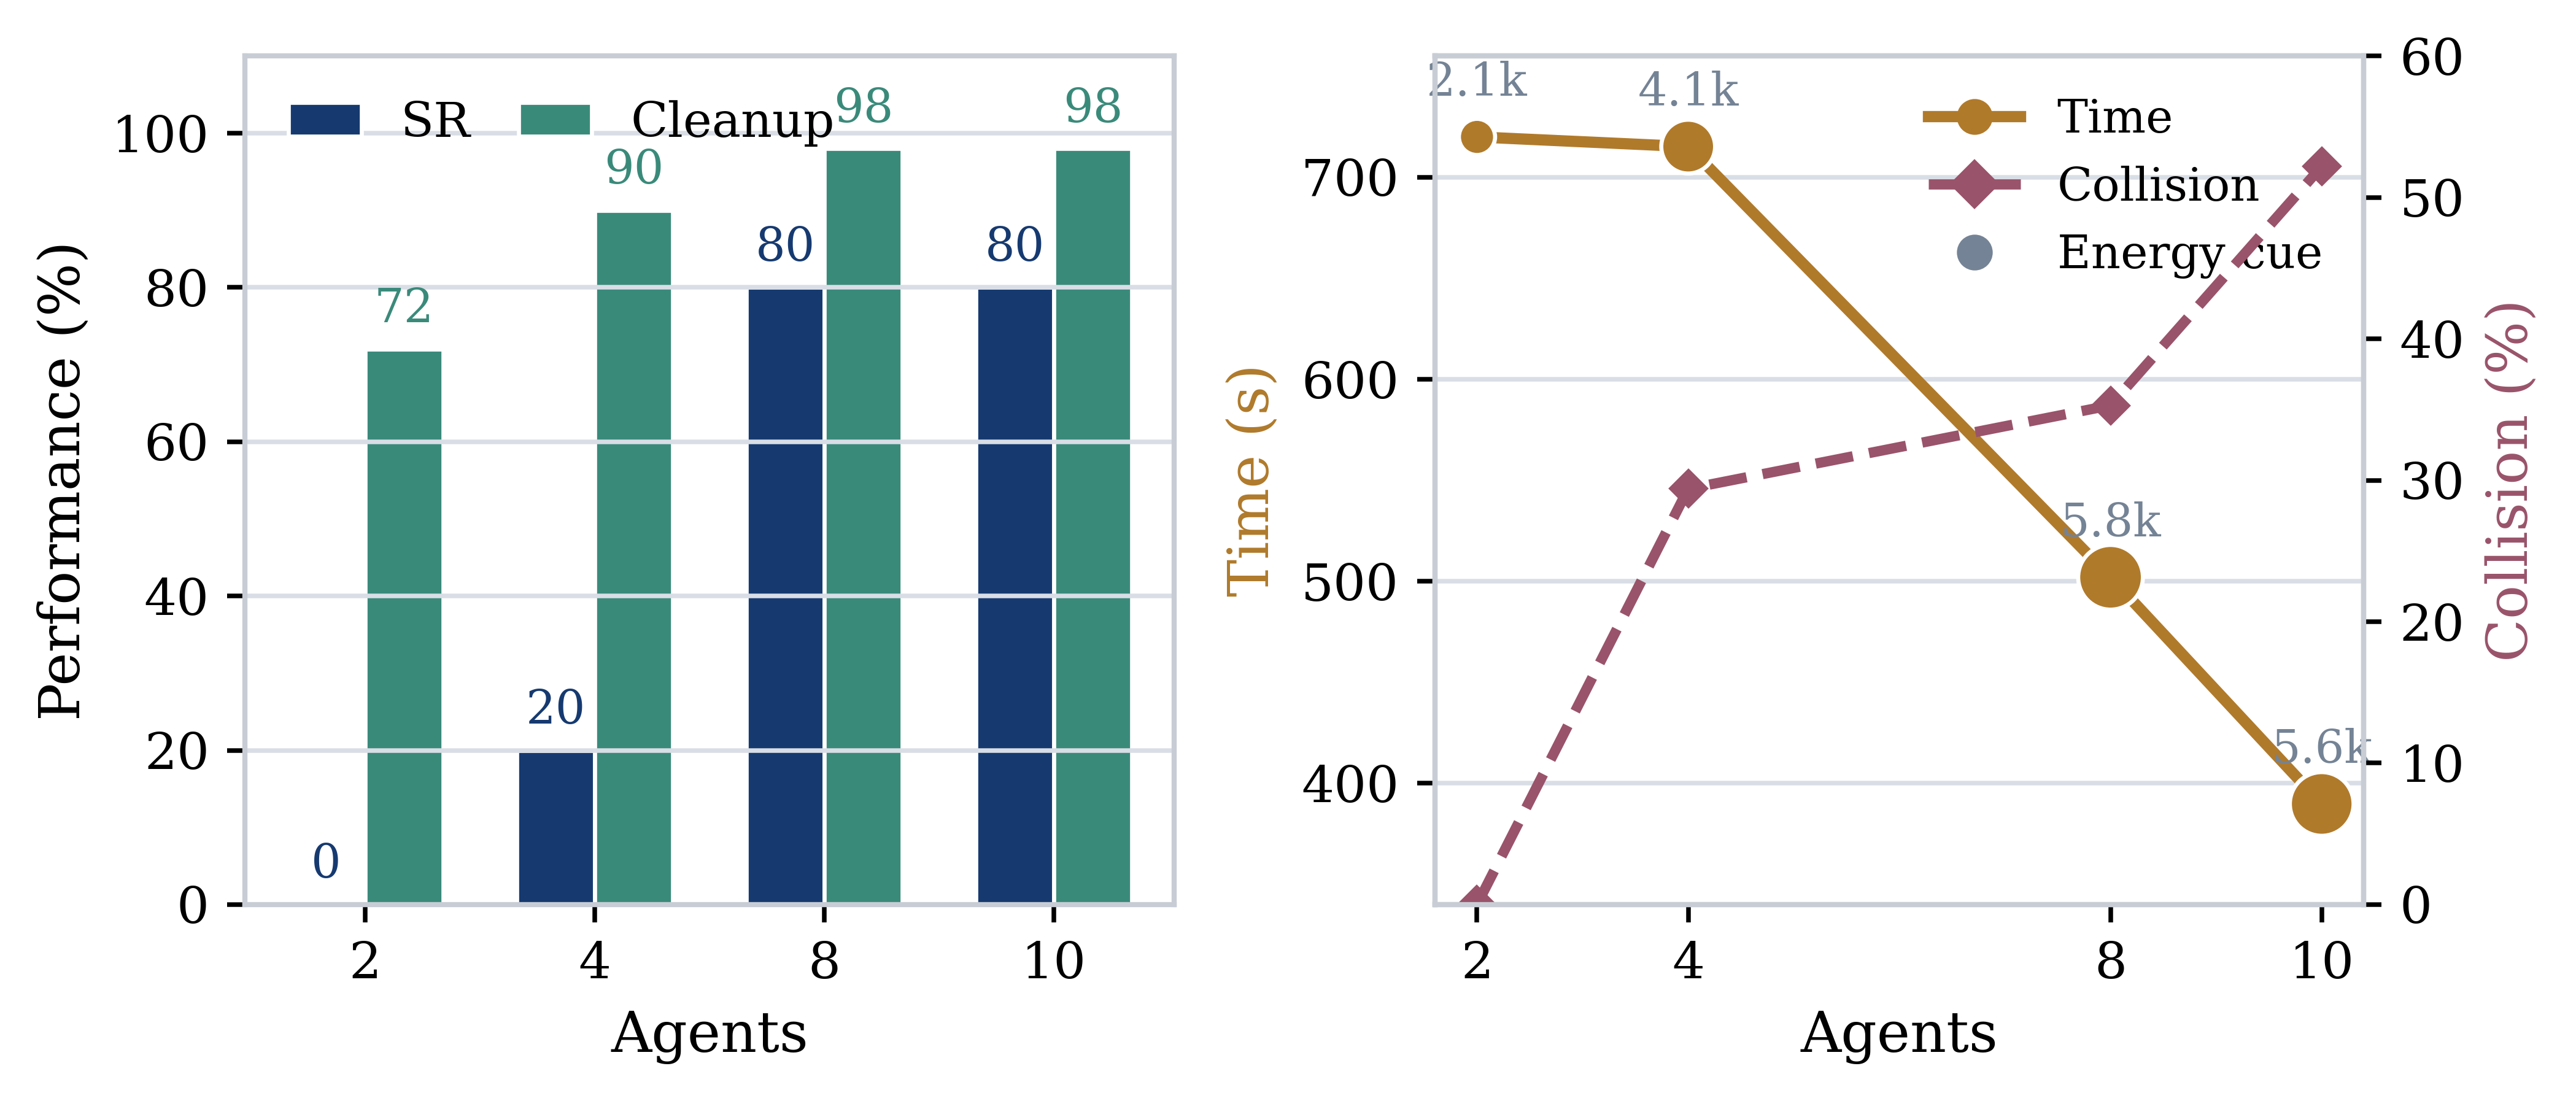
Surface cleanup scaling shows the trade-off between improved cleanup outcomes and higher coordination cost.

Planning-sensitive tasks: heuristic, BC, and LLM planners

Tier 2 planning results under stronger currents. LLMs select source assignments or waypoints; all LLM runs use the same low-level controller and safety checks.

Method SR avg (%) Cleanup SR (%) Cleanup rate Scan SR (%) Scan cov. Pipe SR (%) Pipe score T (s) E
Heuristic 65.8 60.0 0.87 77.5 0.80 60.0 0.69 776.8 9132.4
BC 45.0 10.0 0.32 67.5 0.79 57.5 0.61 921.6 6908.2
LLM-ChatGLM3-6B 55.0 60.0 0.87 77.5 0.82 27.5 0.54 860.3 9671.5
LLM-Qwen2.5-7B 47.5 57.5 0.81 57.5 0.78 27.5 0.57 1077.2 11703.8
LLM-Qwen2-7B 45.0 57.5 0.86 67.5 0.81 10.0 0.51 991.4 10422.1
LLM-Mistral-7B 42.5 55.0 0.82 55.0 0.78 17.5 0.52 1044.2 11288.9
LLM-Llama3-8B 44.2 67.5 0.84 47.5 0.77 17.5 0.59 1099.1 11614.2
LLM-Llama2-7B 30.8 55.0 0.87 27.5 0.75 10.0 0.46 1156.4 11654.3

External underwater scene transfer

Route-following results across four underwater scenes using currents exported from OneOcean.

Scene Tier 2 Tier 3
SR (%) Waypoints CTE (m) SR (%) Waypoints CTE (m)
Dam 0.0 1.0 3.06 0.0 0.0 0.87
OpenWater 20.0 3.1 2.50 0.0 0.0 1.91
PierHarbor 56.7 3.5 2.22 0.0 2.0 1.41
SimpleUnderwater 100.0 4.0 3.04 96.7 3.0 2.16
Mean over scenes 44.2 2.92 2.70 24.2 1.25 1.59

Demos

Task demonstrations from the core and underwater-scene backends.

Core benchmark examples

Fish Protection / Herding

Multi-agent fish herding under ocean currents.

Formation Transit

Multi-agent formation transit under ocean currents.

External underwater scene examples

PierHarbor plume containment demo

PierHarbor Plume Containment

Surface plume containment behavior in a packaged harbor scene with OneOcean current injection.

PierHarbor plume localization demo

PierHarbor Plume Localization

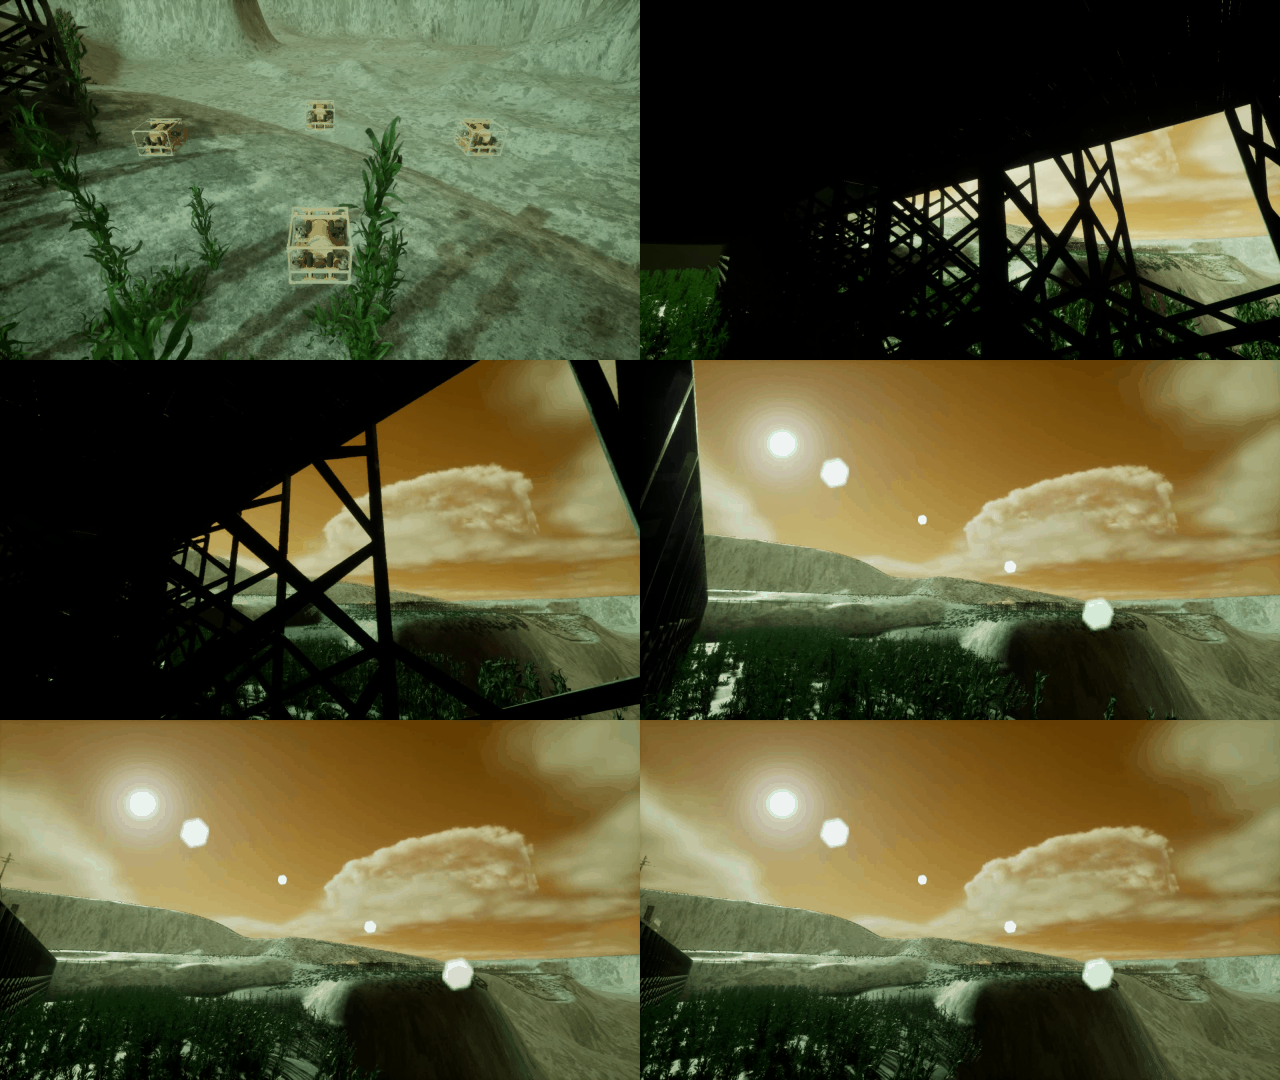
Plume-source localization in PierHarbor.

OpenWater formation keyframe

OpenWater Formation Deployment

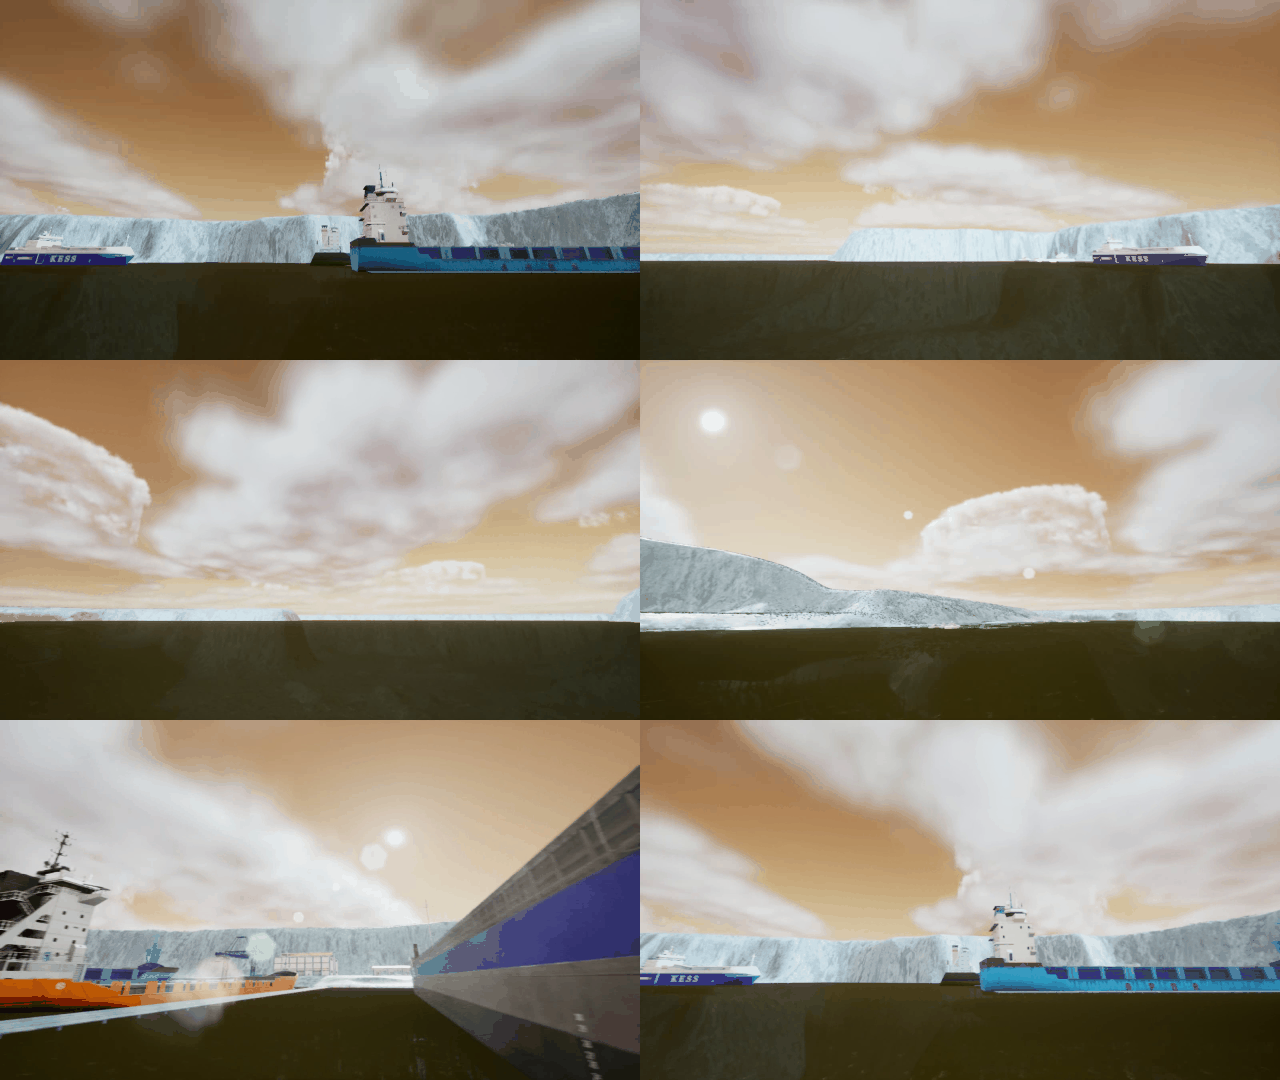
Formation transit in OpenWater.